Import Wizard
File -> Import -> Import Wizard
Vendor |
Software |
Format |
Tested With |
|---|---|---|---|
Agilent |
Mass Hunter |
.b directory |
7500,7700,8900 |
PerkinElmer |
.xl files |
||
Thermo |
Qtegra |
.csv |
iCAP RQ |
pew² supports drag-and-drop of specific formats (Drag-and-drop formats supported by pew².) and text-images with the extension ‘.csv’ or ‘.txt’. If drag-and-drop of a format is not supported or if special import requirements are needed then the import wizard should be used. The Import Wizard allows users to provide specific options (Format options available in the Import Wizards.) when importing data. The wizard consists of three pages: format selection, path and options, and laser parameters. For programs that export lines as a directory of separate files the ‘.csv’ import option should be used.
Format |
Option |
Description |
|---|---|---|
Agilent |
Data File Collection |
The method by which .d files are found. If batch logs are malformed use Alphabetical. |
Read names from Acq. |
Read isotope names from the method. |
|
CSV Lines |
Delimiter |
Delimter between values. |
Header / Footer Rows |
Number of rows in file before / after the data. |
|
File Regex |
Regex used to find file names. |
|
Sorting |
Alphabetical sorts normally. Numerical sorts by numbers in the name only. Timestamp using sortkey in strftime format. |
|
Text Image |
Isotope Name |
Name of imported element. |
Thermo iCap |
Export Format |
Data in rows or columns. |
Delimiter |
Delimter between values. |
|
Decimal |
Character used as decimal place. |
|
Use Analog |
Import analog data instead of counts. |
Parameters from Laser configuration import parameters. will be automatically read from imports if available but otherwise can be manually entered. Laser pixel aspect and sizes are defined by these parameters, with speed * scantime width and spotsize height.
Parameter | Unit |
Description |
|
Spotsize | μm |
Diameter of the laser spot. Defines y-axis line spacing. |
|
Speed | μm/s |
Scanning speed of the laser along the x-axis. |
|
Scantime | s |
Acquistion time for each pixel; Total dwell time for all elements. |
|
ImzML Import Wizard
File -> Import -> ImzML Import Wizrd
Drag-and-Drop -> .imzml and .idb files
This wizard imports data stored in the Imaging Mass Spectrometry Markup Language (imzML) format. Each data set (image) consists of an XML metadata file (.imzML) and an external binary (.ibd). Both files should be in the same directory for easiest import.
To use the wizard, first select the paths to the .imzML and .ibd files. The imzML will then be parsed.
Note
Parsing the imzML can take several seconds for large images, press cancel to stop parsing.

An imported imzML showing the currently selected m/z at a mass width of 10 ppm.
Once the imzML has been parsed an image of the TIC is displayed, next to a table of Target masses. Left-click any pixel to show the recorded mass spectrum below. The mass spectrum can then be used to select (single-click) and display (double-click) any m/z with the selected mass window in ppm.
Selected masses will be added to the Target masses table, m/z values can also be manually entered or pasted. Clicking any m/z in the table will update the displayed image.
Pressing Finish will import all the current masses in the Target masses table at the selected mass width.
LaserLog Import Wizard
File -> Import -> ESL Laser Log Wizard
Drag-and-Drop -> Log and laser data files
This wizard guides you through importing ICP-MS data and aligning it with a ESL laser ablation log file. ICP-MS data should be collected as one line/sample or one file per laser pattern, multiple batches can be imported per log.
Note
To use this import make sure to activate the save Iolite log file option on the ActiveView2 home page, before ablating.
On the first page open or drag-and-drop the laser log file, this is usually named in the format ‘LaserLog_YY-mm-dd_HH-MM-SS.csv’.
The next two pages import laser data and instructions in Import Wizard should be followed. Only data formats that save the event times are supported (Agilent batches, Perkin-Elmer ‘XL’ and Thermo iCap CSV).
Warning
Currently only Agilent data has been tested with the importer.

The ESL Import groups page. Here both pattern per sample and pattern per file data has been selected for import.
The groups page shows all imported patterns and data files. Drag the laser files to match with their corresponding laser log patterns.
Checking the Split data into rows can be used if data has been collected as one line/sample per pattern. This will add a row X parameter to each laser line.
Imported data is previewed on the next page, and the back button can be used to make changes to pattern-laser groupings. A Delay control is provided for instrument setups with a long transport time (time taken for ablations to reach the ICP-MS). Laser images are imported with their real world positions and parameters and a final control, Remove space between images, can be used to collapse any empty space between images and make the scene more compact.
Spot-wise Import Wizard
File -> Import -> Spotwise Import Wizard
This wizard allows the import data collected in a spot-wise manner. Imported data files are joined into a single continuous signal which is then used to find and integrate peaks. Peaks can be detected using the algorithms in Peak detection algorithms and parameters.. Peak detection is only perform on one element, all other elements will be integrated using the previously detected positions.
Algorithm |
Parameter |
Description |
|---|---|---|
Constant Value |
Minimum value |
Continuous signals above this value are considered peaks. |
CWT |
Min. / Max. width |
CWT widths, should cover the expected peak width / 2. |
Width factor |
Peak width multiplier. |
|
Min. ridge SNR |
The minimum SNR for a CWT ridge to be considered a peak. |
|
Min. ridge length |
The minimum continuous CWT ridge length. |
|
Moving window |
Window size |
Size of the rolling window. |
Window baseline |
Method for determining the signal baseline. |
|
Window threshold |
Method for determining signal threshold. |
|
Threshold |
Value used for thresholding. If ‘Constant’ the threshold is set to baseline + Threshold. If ‘Std’ the threshold is set to baseline + Threshold * stddev. |
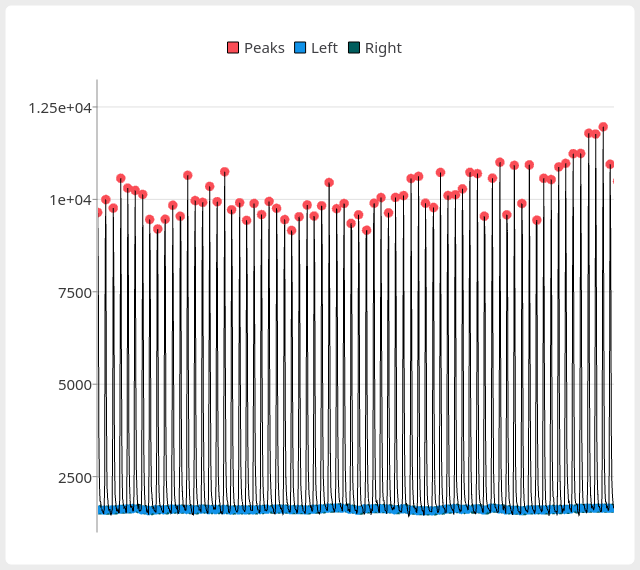
The Spotwise Wizard signal / peak detection chart.
The signal display shows the currently loaded signal with peak positions (top, left, right) marked. The view can be navigated using the scroll-wheel and middle mouse button. Peak bases and heights can be set to the algorithms in Peak base and height algorithms. using the Peak base and Peak height combo boxes. Peak base is used to determine the peak area while peak heights are directly set by the Peak height method. Peaks can be filtered using the Minimum area, Minimum height and Minimum width inputs. Once the correct number of peaks are obtained continue onto The Spotwise Wizard import preview page..
Target |
Method |
Description |
|---|---|---|
Base |
baseline |
A baseline is computed using the 25th percentile of the area surrounding the peak. |
edge |
The lower of the two edge points. |
|
prominence |
The higher of the two edge points. |
|
minima |
The lowest point within the peak. |
|
zero |
Set the baseline to zero. |
|
Height |
center |
Height is taken as the centermost point of the peak. |
maxima |
The maximum value of the peak. |
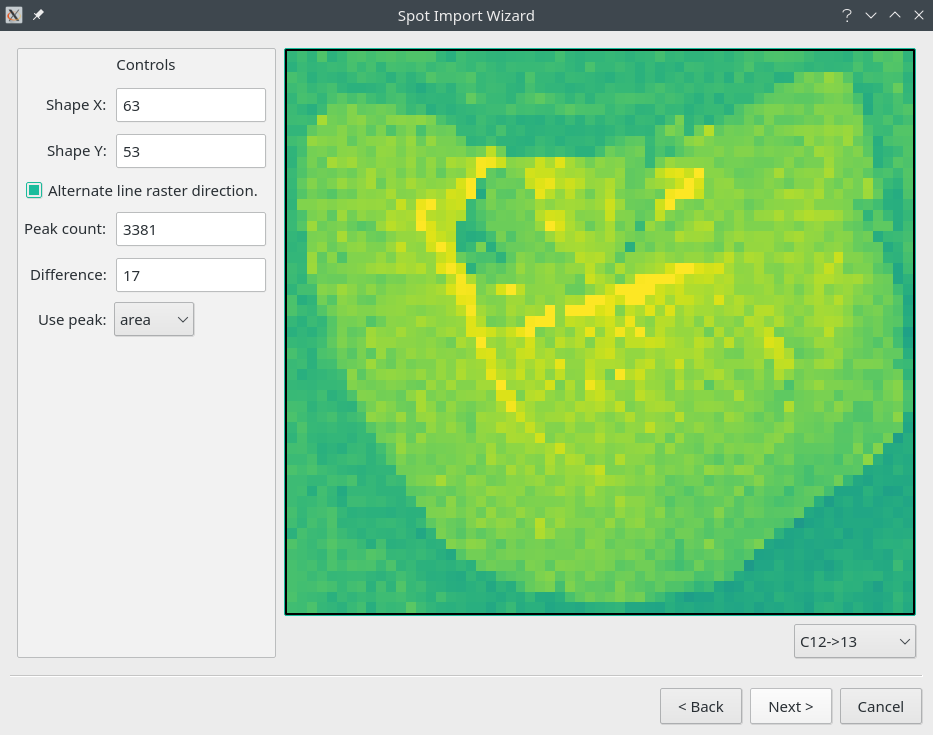
The Spotwise Wizard import preview page.
The preview page allows you to set the expected shape of the final image. The Difference output will show the difference in the shape to the current peak detection count. Rastered collections should enabled the alternating raster option. Once the image is correct the spotsize can be entered on the following page.